Question 11:
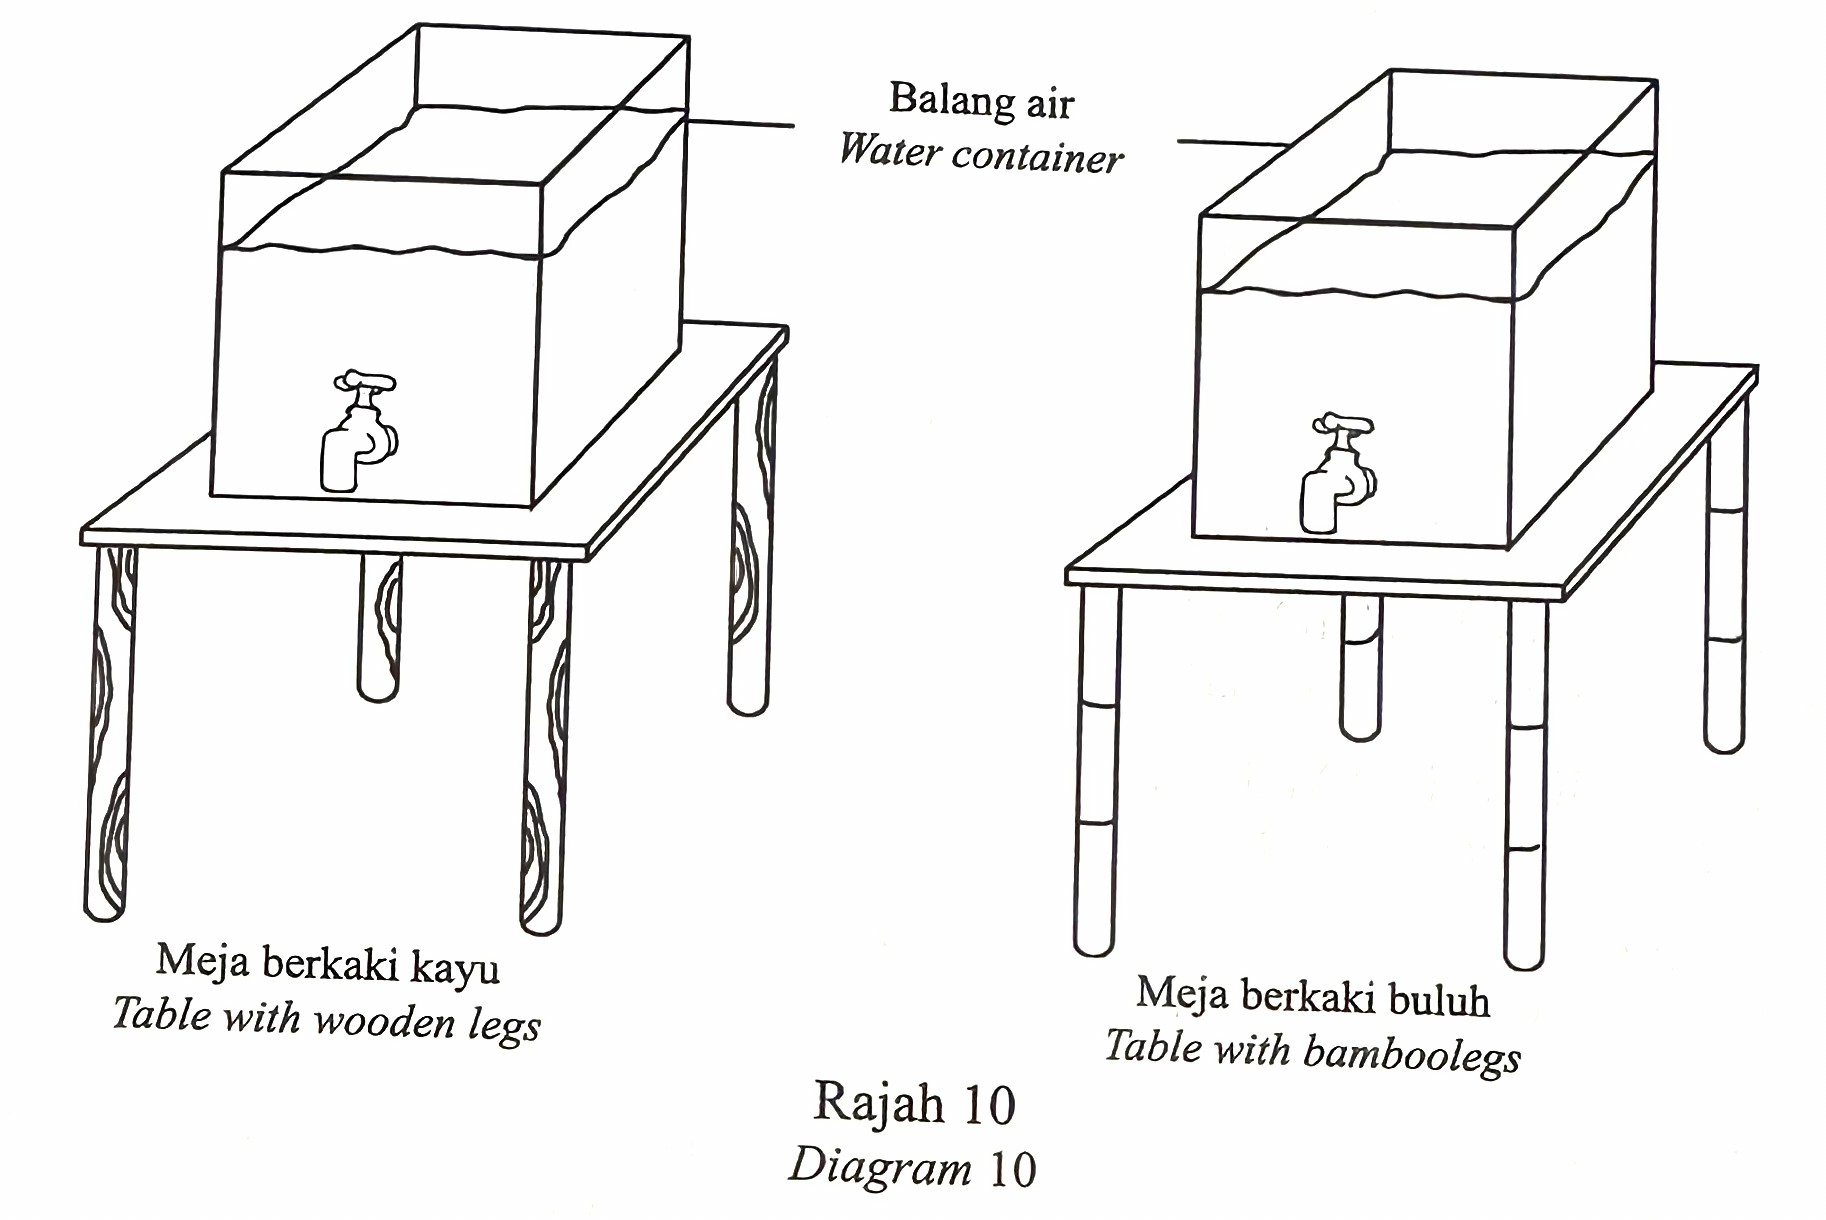
Diagram 10 shows the conversation between Ali and Mutu.
Ali : The water container should not be placed on the table with wooden legs. It will break easily.
Mutu : Oh, is it true? Isn’t wood stronger than bamboo?
Based on the conversation in Diagram 10, plan one experiment in the laboratory by using A4 sized papers, textbooks and other materials and apparatus.
Your plan must contain the following aspects:
(a) Problem statement
[1 mark]
(b) Hypothesis
[1 mark]
(c)(i) Manipulated variable
[1 mark]
(ii) PResponding variable
[1 mark]
(d) Sketching of the labelled materials and apparatus arrangement
[2 marks]
(e) Prediction of observation that supports your hypothesis
[1 mark]
(f) Three aspects that are needed to draw the bar chart of the experiment.
[3 marks]
Answer:
(a)
Is a table with wooden legs stronger than a table with bamboo legs to support a water jar?
Explanation:
This question arose from a conversation between Ali and Mutu about the strength of a table with wooden legs compared to a table with bamboo legs (the situation should be included in the problem statement).
(b)
A table with bamboo legs (hollow) is stronger at supporting a jar of water than a table with wooden legs (solid).
Explanation:
This hypothesis supports Ali’s view that tables with wooden legs break easily.
(c)(i)
Types of cylinders // Hollow cylinders and solid cylinders
Explanation:
A manipulated variable (PM) is something that needs to be changed/altered/ differentiated in an experiment. If it is not changed/altered/differentiated the experiment will not be successful and this will usually be something different from the beginning of the experiment.
(c)(ii)
The number of textbook that can be supported by cylinder
Explanation:
The responding variable is the outcome of the experiment or investigation that is seek.
(d)
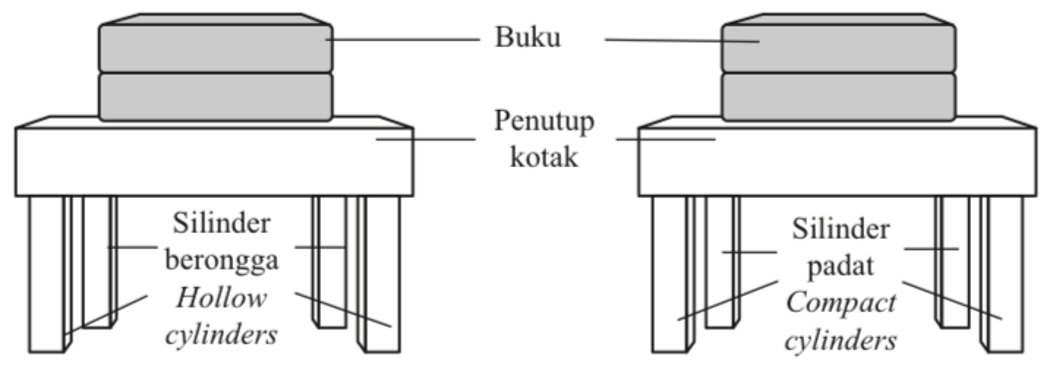
Explanation:
– Functional diagram
– At least 3 labels
(e)
The number of books that can be supported by a hollow cylinder is greater (than a compact cylinder).
Explanation:
A compact cylinder stronger than the hollow cylinder.
(f)
– X-axis: Type of cylinder
– Y-axis: The number of textbook that can be supported by cylinder
– Title of the bar chart: The number of textbook that can be supported by cylinder against type of cylinder
Explanation:
– The X -axis represents the manipulated variable.
– The Y -axis represents the responding variable.
– The title gives an overview of what is being compared in the chart and helps the reader understand the context of the experiment.
Diagram 10 shows the conversation between Ali and Mutu.
Ali : The water container should not be placed on the table with wooden legs. It will break easily.
Mutu : Oh, is it true? Isn’t wood stronger than bamboo?
Based on the conversation in Diagram 10, plan one experiment in the laboratory by using A4 sized papers, textbooks and other materials and apparatus.
Your plan must contain the following aspects:
(a) Problem statement
[1 mark]
(b) Hypothesis
[1 mark]
(c)(i) Manipulated variable
[1 mark]
(ii) PResponding variable
[1 mark]
(d) Sketching of the labelled materials and apparatus arrangement
[2 marks]
(e) Prediction of observation that supports your hypothesis
[1 mark]
(f) Three aspects that are needed to draw the bar chart of the experiment.
[3 marks]
Answer:
(a)
Is a table with wooden legs stronger than a table with bamboo legs to support a water jar?
Explanation:
This question arose from a conversation between Ali and Mutu about the strength of a table with wooden legs compared to a table with bamboo legs (the situation should be included in the problem statement).
(b)
A table with bamboo legs (hollow) is stronger at supporting a jar of water than a table with wooden legs (solid).
Explanation:
This hypothesis supports Ali’s view that tables with wooden legs break easily.
(c)(i)
Types of cylinders // Hollow cylinders and solid cylinders
Explanation:
A manipulated variable (PM) is something that needs to be changed/altered/ differentiated in an experiment. If it is not changed/altered/differentiated the experiment will not be successful and this will usually be something different from the beginning of the experiment.
(c)(ii)
The number of textbook that can be supported by cylinder
Explanation:
The responding variable is the outcome of the experiment or investigation that is seek.
(d)
Explanation:
– Functional diagram
– At least 3 labels
(e)
The number of books that can be supported by a hollow cylinder is greater (than a compact cylinder).
Explanation:
A compact cylinder stronger than the hollow cylinder.
(f)
– X-axis: Type of cylinder
– Y-axis: The number of textbook that can be supported by cylinder
– Title of the bar chart: The number of textbook that can be supported by cylinder against type of cylinder
Explanation:
– The X -axis represents the manipulated variable.
– The Y -axis represents the responding variable.
– The title gives an overview of what is being compared in the chart and helps the reader understand the context of the experiment.