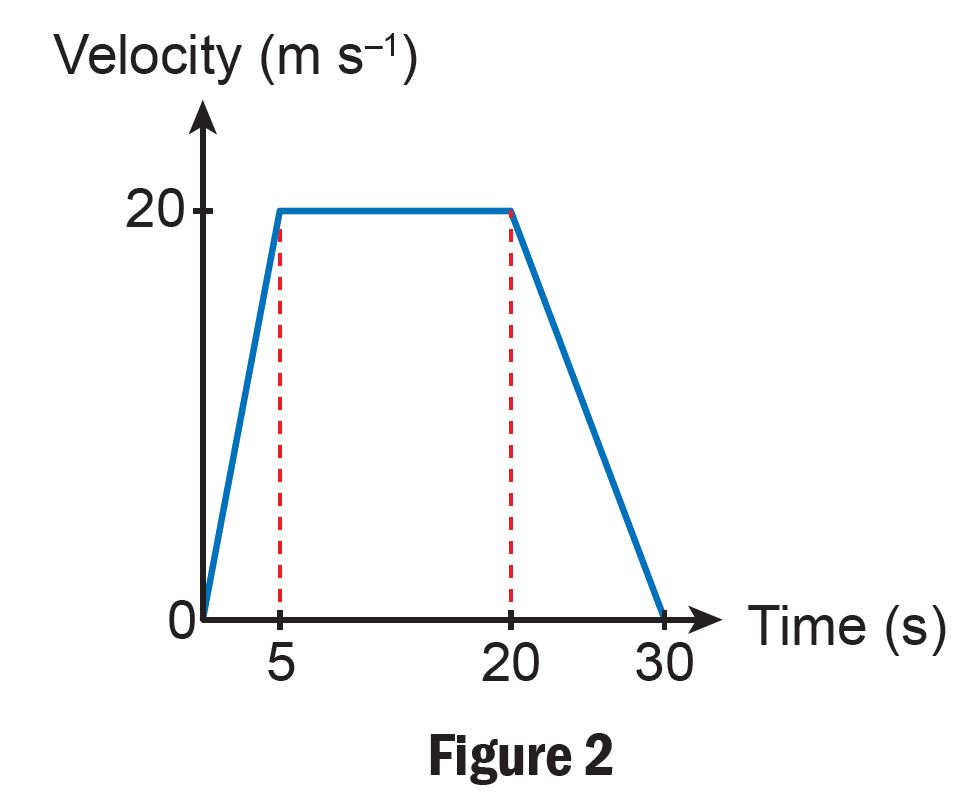
Figure 2 is a graph that shows the motion of a car.
Based on the graph above,
(a) what represents acceleration?
(b) what is the acceleration of the car from 0 to 5 seconds?
(c) determine the total displacement of the car.
Answer:
(a) Gradient of graph
(b) 20 m s–1 ÷ 5 s = 4 m s–2
(c) ½ × (30 s + 15 s) × 20 m s–1 = 450 m
Figure 3 shows the motion of objects P and Q that are released simultaneously.
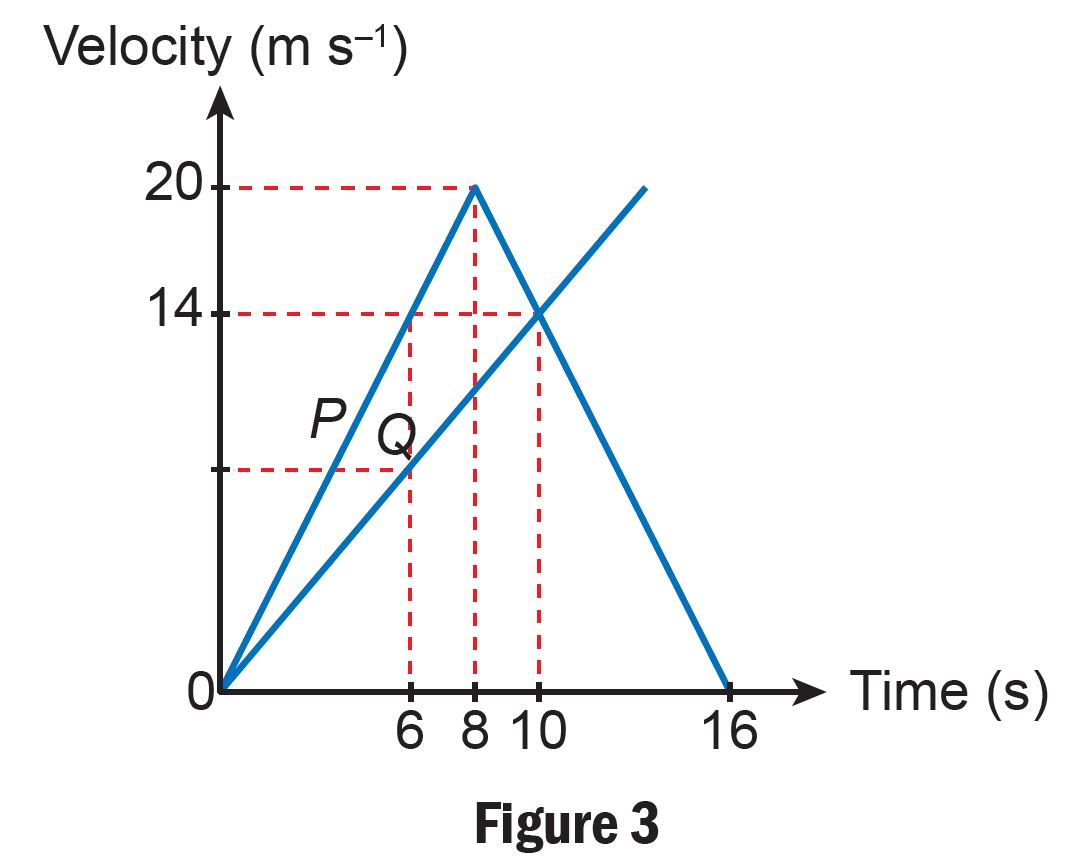
(a) Based on the gradient of graphs P and Q, which graph shows the higher value of acceleration at the 6th second? Explain your answer.
(b) Determine the gradient of graph P from 0 to 8 seconds.
Answer:
(a)
Graph P because its gradient is greater compared to Q. Value of gradient represents the value of acceleration.
(b)
20 m s–1 ÷ 8 s = 2.5 m s–2
Figure 4 shows a ticker tape strip of 16 cm in length.
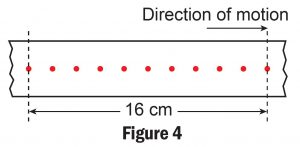
The time between two consecutive dots is 0.02 seconds.
(a) Determine the velocity of the ticker tape strip.
(b) Determine the acceleration of the ticker tape strip. Explain your answer.
Answer:
(a)
16 cm ÷ 0.2 s = 80 cm s–1
(b)
0 cm s–2/ zero. This is because the velocity of the ticker tape strip is constant.