Question 1:
Diagram shows the carbon cycle.
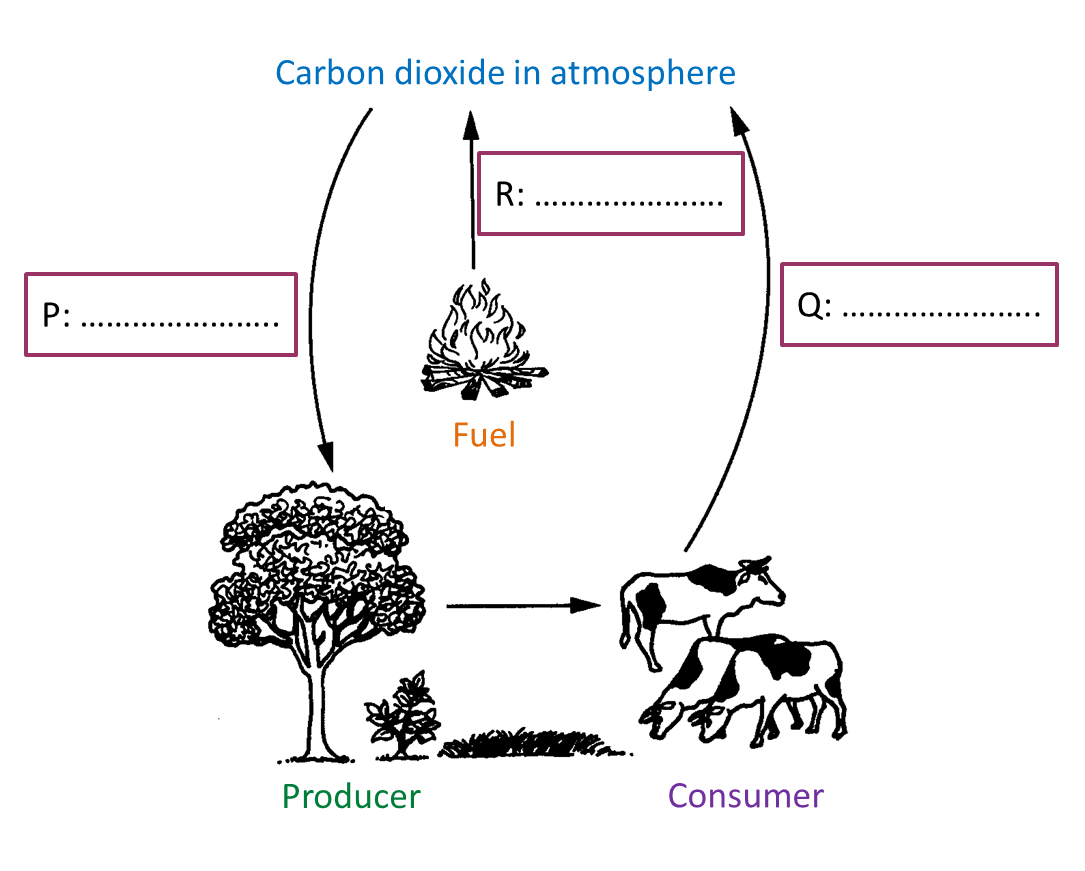
(a) In Diagram, name process P, Q and R using the following information. [3 marks]

(b) What will happen to the number of consumers if all producers die? [1 mark]
(c) Fill in the blanks with the words given.

Uncontrolled logging will ____(i)_____ the population of producer. Therefore, the quantity of carbon dioxide in atmosphere will ____(ii)_____. [2 marks]
Answer:
(a)
P: Photosynthesis
Q: Respiration
R: Burning
(b) The number of consumer decreases.
(c)(i) decrease
(c)(ii) increase
Diagram shows the carbon cycle.
(a) In Diagram, name process P, Q and R using the following information. [3 marks]
(b) What will happen to the number of consumers if all producers die? [1 mark]
(c) Fill in the blanks with the words given.
Uncontrolled logging will ____(i)_____ the population of producer. Therefore, the quantity of carbon dioxide in atmosphere will ____(ii)_____. [2 marks]
Answer:
(a)
P: Photosynthesis
Q: Respiration
R: Burning
(b) The number of consumer decreases.
(c)(i) decrease
(c)(ii) increase