Question 1:
A group of students carried out an experiment to investigate the type of variation for the types of blood group among the students.
Diagram 1 shows the types of blood groups for 20 students.
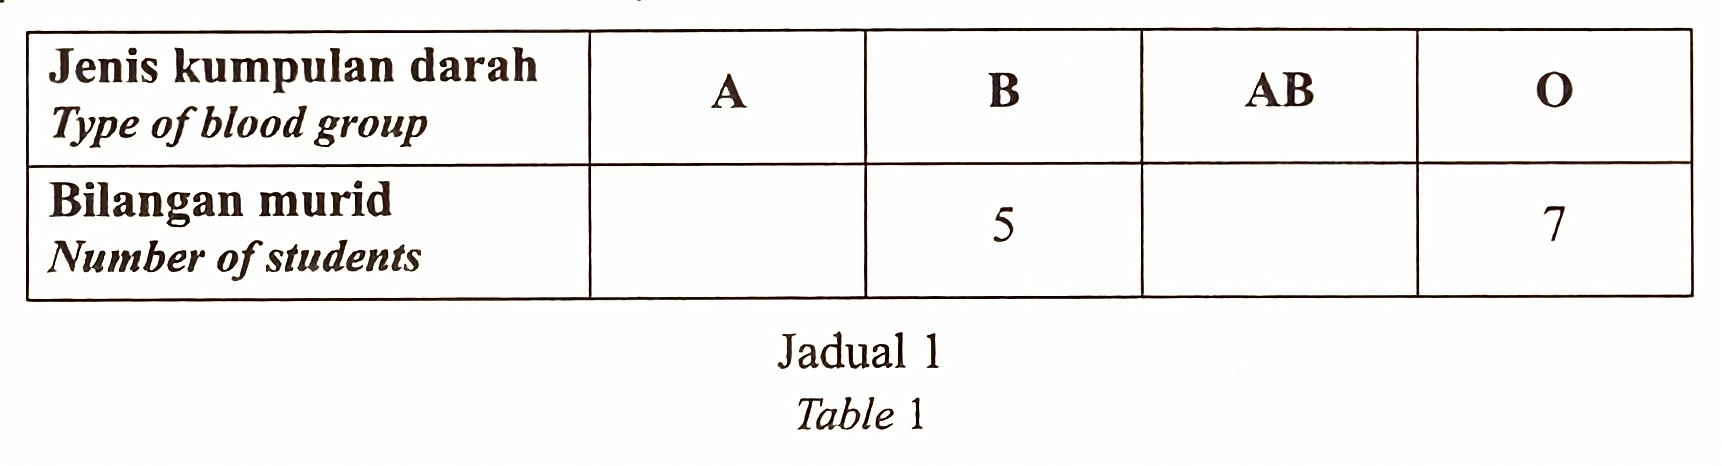
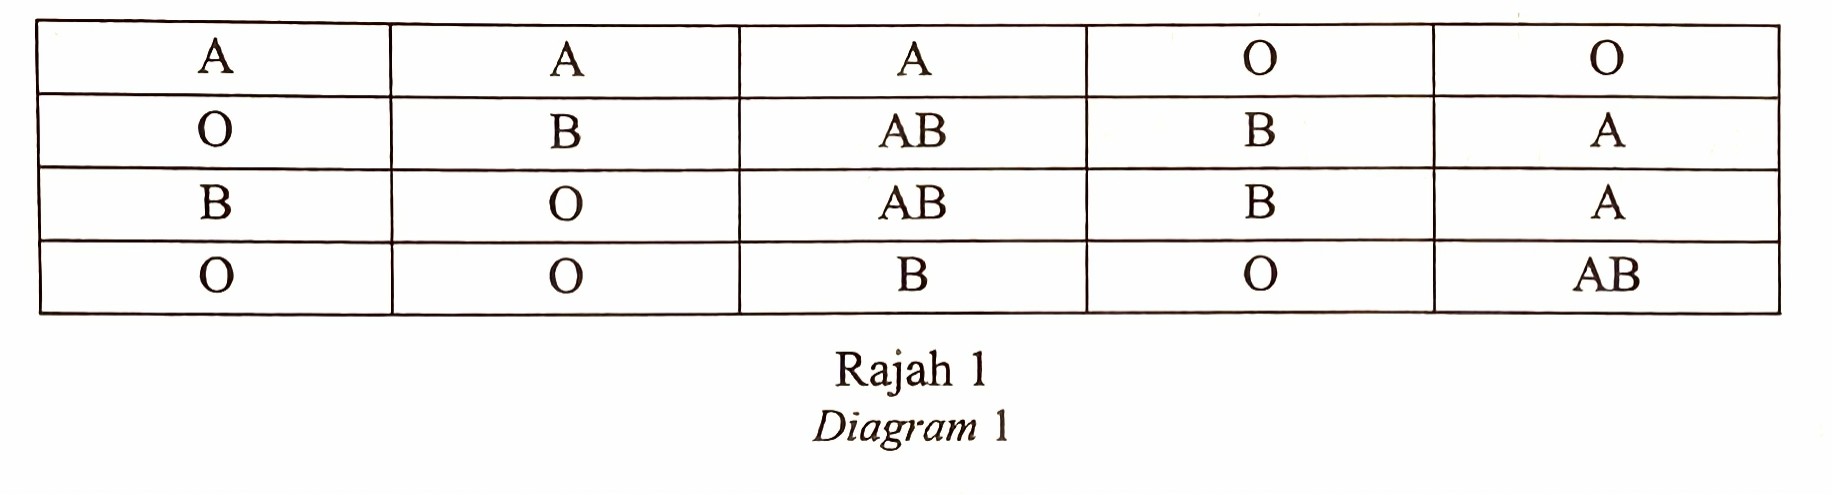 (a) Complete Table 1 to show the number of students for each type of blood group. [2 marks]
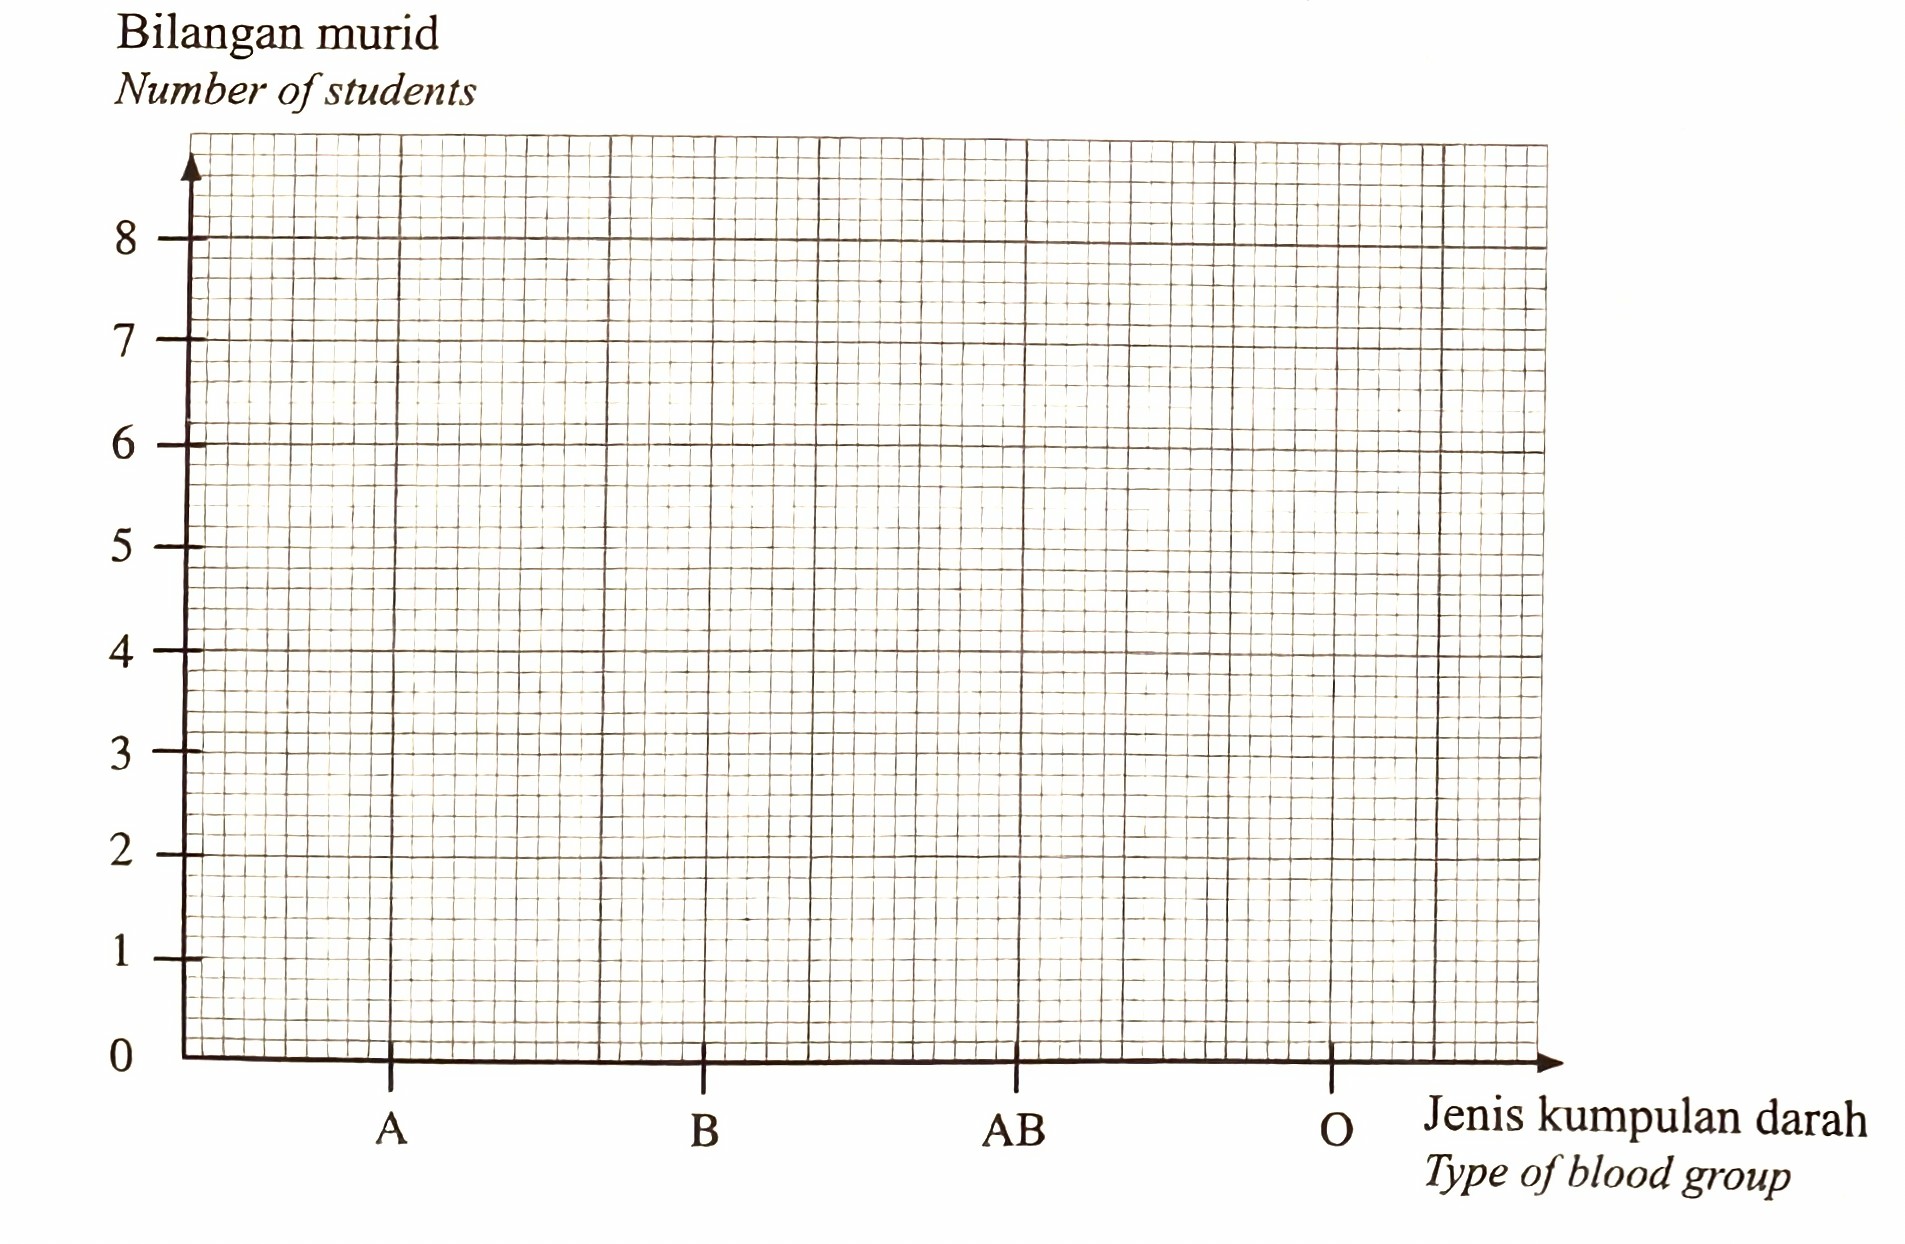
(b) Based on the data in Table 1, draw a bar chart to represent the type of variation. [2 marks]
 (c) The following statement shows a conclusion made by a group of students.
Based on Table 1 or graph in 1(b), state one information to support the conclusion. [1 mark]
Answer:
(a) A : 5
AB : 3
(b)
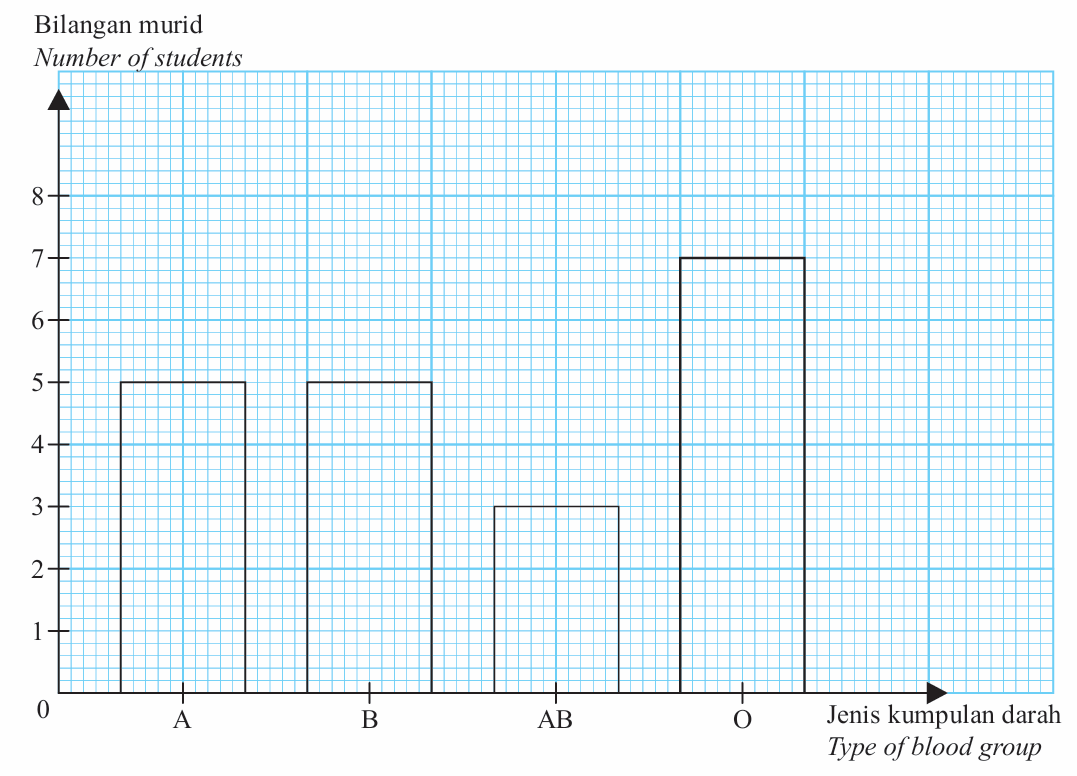 1. All 4 bars drawn at correct height
2. Equal spacing between all bars
(c)
1. The graph for blood groups is discrete.
2. There are no intermediate values for blood groups.
(Any one answer)
A group of students carried out an experiment to investigate the type of variation for the types of blood group among the students.
Diagram 1 shows the types of blood groups for 20 students.
(a) Complete Table 1 to show the number of students for each type of blood group. [2 marks](b) Based on the data in Table 1, draw a bar chart to represent the type of variation. [2 marks]
(c) The following statement shows a conclusion made by a group of students.| Type of blood group is a discontinuous variation. |
Answer:
(a) A : 5
AB : 3
(b)
1. All 4 bars drawn at correct height2. Equal spacing between all bars
(c)
1. The graph for blood groups is discrete.
2. There are no intermediate values for blood groups.
(Any one answer)
Question 2:
Table 2 shows the results of an experiment carried out to study a factor that affects the rate of reaction at room temperature.
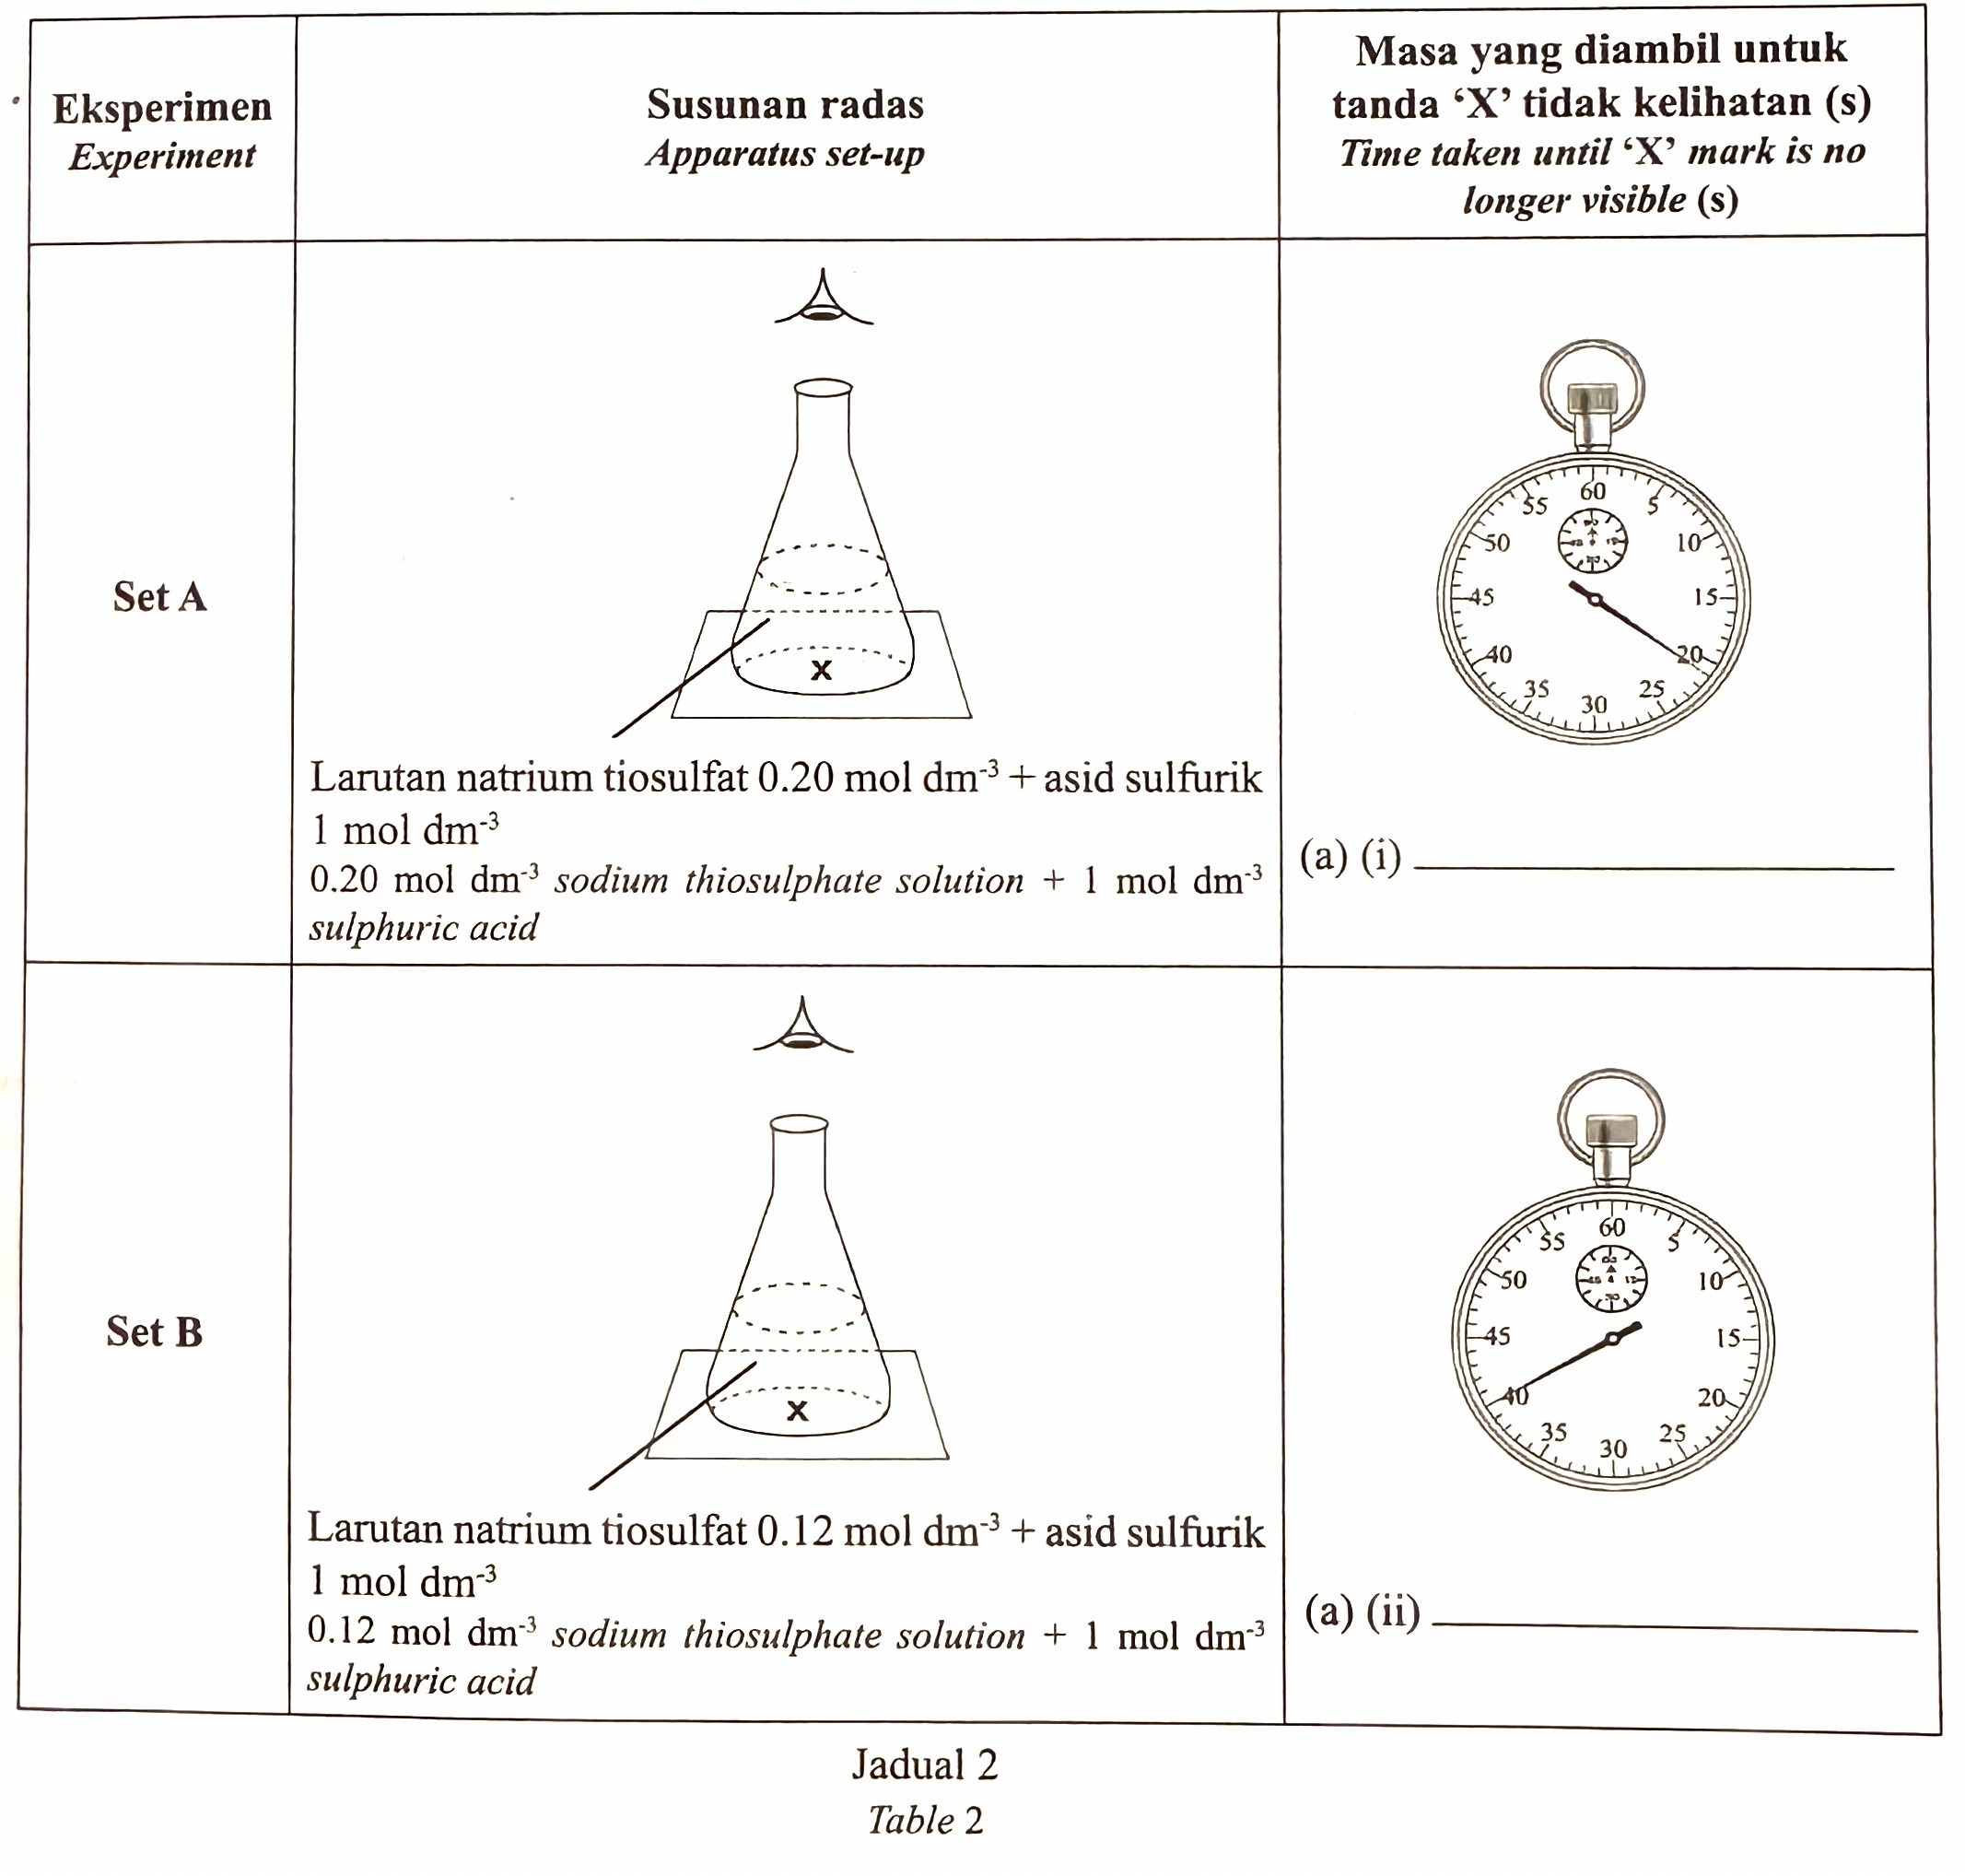
(a) Complete Table 2. [2 markah]
(b) The experiment is repeated by using 0.16 mol dm-3 sodium thiosulphate solution.
Predict the time taken until ‘ X ‘ mark is no longer visible.
[1 mark]
(c) Based on Table 2, state the relationship between the concentration of reactants and the time taken until ‘ X ‘ mark is no longer visible. [1 mark]
(d) A student makes the following hypothesis.
The hypothesis is accepted.
By using the information in Table 2, state a reason.
[1 mark]
Answer:
(a)(i) 21 s
(a)(ii) 40 s
(b) 30 s
Students must give a value between 21 s and 40 s.
(c) The higher the concentration of sodium thiosulphate, the shorter the time taken until ‘X’ mark is no longer visible
(d) Set A has a higher concentration of sodium thiosulphate and takes a shorter time for the ‘X’ mark to disappear compared to Set B.
Table 2 shows the results of an experiment carried out to study a factor that affects the rate of reaction at room temperature.
(a) Complete Table 2. [2 markah]
(b) The experiment is repeated by using 0.16 mol dm-3 sodium thiosulphate solution.
Predict the time taken until ‘ X ‘ mark is no longer visible.
[1 mark]
(c) Based on Table 2, state the relationship between the concentration of reactants and the time taken until ‘ X ‘ mark is no longer visible. [1 mark]
(d) A student makes the following hypothesis.
| The higher the concentration of the reactants, the higher the rate of reaction. |
By using the information in Table 2, state a reason.
[1 mark]
Answer:
(a)(i) 21 s
(a)(ii) 40 s
(b) 30 s
Students must give a value between 21 s and 40 s.
(c) The higher the concentration of sodium thiosulphate, the shorter the time taken until ‘X’ mark is no longer visible
(d) Set A has a higher concentration of sodium thiosulphate and takes a shorter time for the ‘X’ mark to disappear compared to Set B.