Question 4:
Diagram 4.1 shows of apparatus set-up for an experiment carried out by a student.

Diagram 4.2 shows a graph plotted based on the results of the experiment.
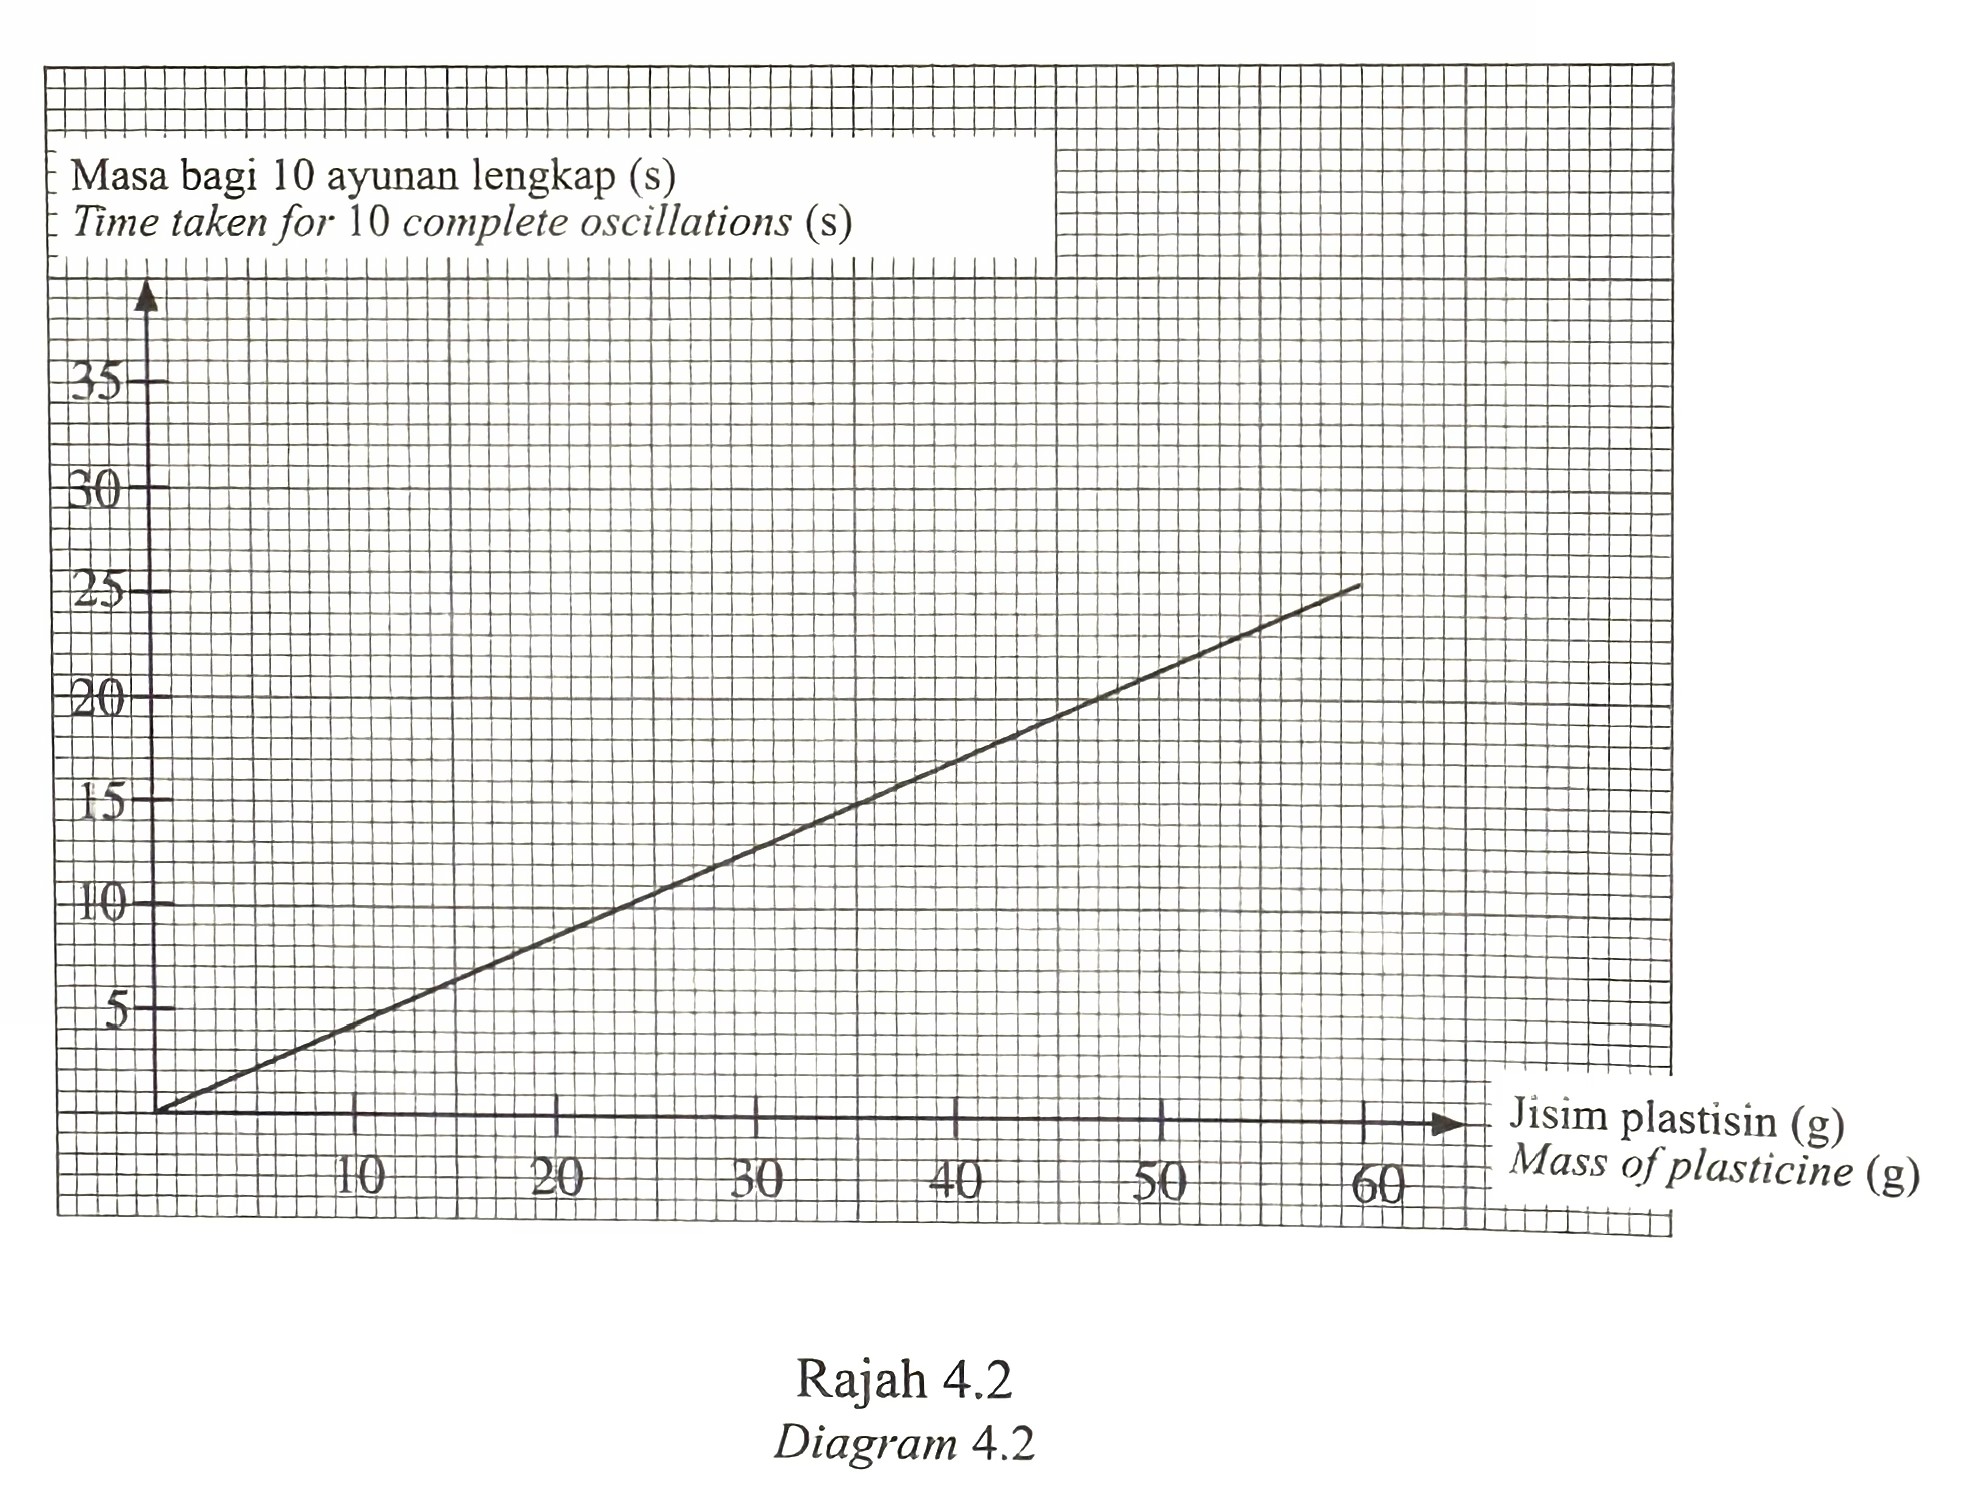
Based on the graph in Diagram 4.2, state
(i) the mass of plasticine that can produce the longest time of 10 complete oscillations
[1 mark]
(ii) the mass of plasticine that has the biggest inertia
[1 mark]
(iii) time taken for 10 complete oscillations if the student uses plasticine with the mass of 35 g.
[1 mark]
(b) The larger the mass of an object, the larger its inertia.
By referring the graph in Diagram 4.2, prove the statement.
[1 mark]
(c) State one apparatus that can be used to measure the time taken for 10 complete oscillations.
[1 mark]
Answer:
(a)(i) 60 g
(a)(ii) 60 g
(a)(iii) 15 s
(b) The bigger the mass, the longer the time taken for 10 complete oscillations
(c) Stopwatch
Diagram 4.1 shows of apparatus set-up for an experiment carried out by a student.
Diagram 4.2 shows a graph plotted based on the results of the experiment.
Based on the graph in Diagram 4.2, state
(i) the mass of plasticine that can produce the longest time of 10 complete oscillations
[1 mark]
(ii) the mass of plasticine that has the biggest inertia
[1 mark]
(iii) time taken for 10 complete oscillations if the student uses plasticine with the mass of 35 g.
[1 mark]
(b) The larger the mass of an object, the larger its inertia.
By referring the graph in Diagram 4.2, prove the statement.
[1 mark]
(c) State one apparatus that can be used to measure the time taken for 10 complete oscillations.
[1 mark]
Answer:
(a)(i) 60 g
(a)(ii) 60 g
(a)(iii) 15 s
(b) The bigger the mass, the longer the time taken for 10 complete oscillations
(c) Stopwatch