Question 1:
Diagram 1.1 and Diagram 1.2 show an experiment to study the reactivity of metals with water.
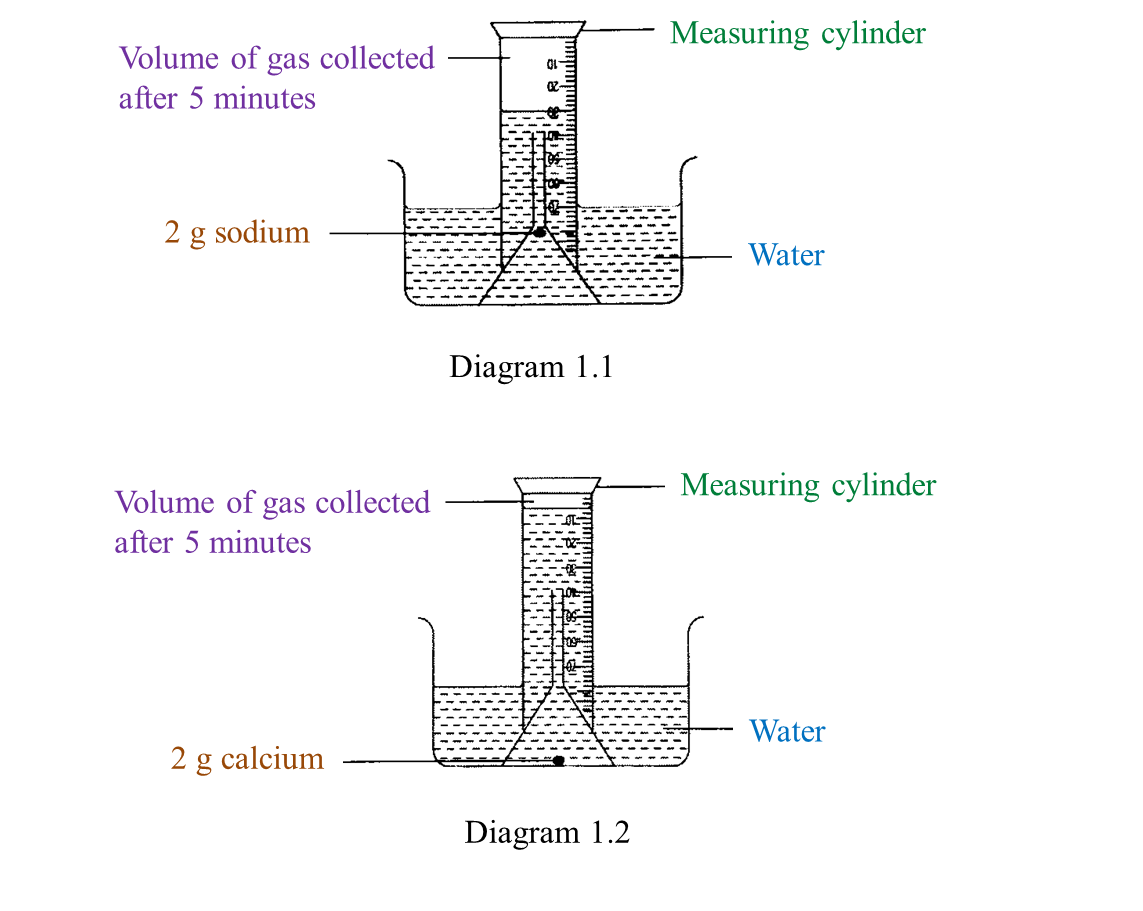
(a) Observe Diagram 1.1. State the volume of gas collected.
Write down your answer in Table below. [1 mark]
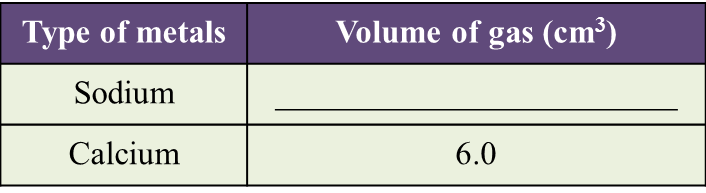
(b) Based on the result in Table above, state one inference. [1 mark]
(c) State the variables in this experiment.
(i) Constant variable [1 mark]
(ii) Responding variable [1 mark]
(d) Based on this experiment, mark (\/) the metal which is more reactive. [1 mark]
Answer:
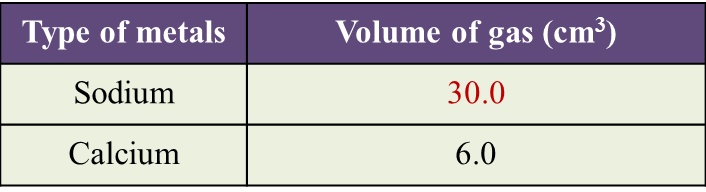
(a)
(b) A reactive metal can displace more gas from water.
(c)(i) The mass of the metal / The time taken
(c)(ii) The volume of gas collected
(d)
Diagram 1.1 and Diagram 1.2 show an experiment to study the reactivity of metals with water.
(a) Observe Diagram 1.1. State the volume of gas collected.
Write down your answer in Table below. [1 mark]
(b) Based on the result in Table above, state one inference. [1 mark]
(c) State the variables in this experiment.
(i) Constant variable [1 mark]
(ii) Responding variable [1 mark]
(d) Based on this experiment, mark (\/) the metal which is more reactive. [1 mark]
Answer:
(a)
(b) A reactive metal can displace more gas from water.
(c)(i) The mass of the metal / The time taken
(c)(ii) The volume of gas collected
(d)